![]()
 |
|||||||
| |
|
|
 |
||||
| |
|
|
|
||||
![]()
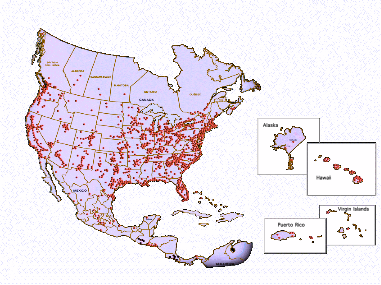
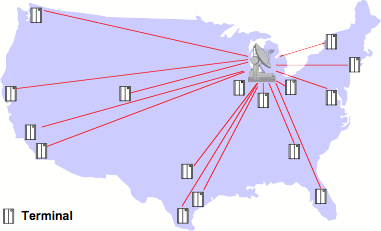
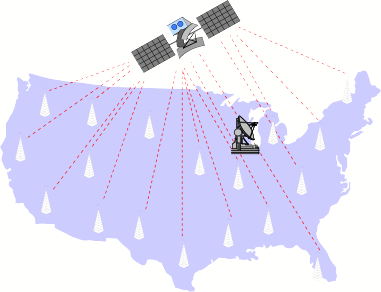
Pitfalls on the way to high speed paging from the service provider’s perspective By Selwyn E. Hill Introduction Most of us in the paging industry are familiar with the issues of simulcasting on a single frequency and the stringent requirements placed on the transmitters and network in order to achieve these tight specifications. The following discussion will not attempt to analyze these issues in great depth since there are other sources that explain this in great detail. I will concentrate mainly on the real world experiences that we have lived through in transitioning to high-speed paging and question some of the original ideas and expectations that were put forward when the FLEX protocol was first introduced. Not having any experience with ERMES, I will not draw any conclusions about its robustness or advantages in the RF world but there are certain features in the FLEX protocol, which make it extremely attractive in the transitioning process. I will focus mainly on RF related issues but may also touch on network issues in the context of our system architecture that play a major role in supporting higher speed protocols. Some of the “growing pains” are relative to specific types of equipment deployed in the network, but will probably serve to highlight where some of the pitfalls can occur, even though different equipment may be involved. PageMart’s satellite based system architecture FIGURE 1: PageMart coverage - NAFTA wide The company currently has over 2 million subscribers, which has been achieved through internal growth, and no acquisitions. It is the fastest growing company in the industry and has added more than 100,000 units in service for the past twelve consecutive quarters. PageMart is ranked fifth largest in the industry and is ranked among the “big four” paging companies in the United States in terms of the amount of nationwide spectrum owned (which includes narrowband PCS channels). These statistics are presented to emphasize the desperate need for high speed paging to keep system capacities ahead of growth projections. This will allow PageMart to continue providing a service, which has minimal delays in the delivery of messages to the end user. These are typically less than a minute. PageMart operates 24 regional terminals across the nation including Honolulu. Figure 2 illustrates an example of the consolidation of messages to a regional terminal in the Midwest. To send a message to a subscriber in Kansas City, a local call is placed, which connects directly to the central office of PageMart’s long distance carrier. The message is then routed to a large regional terminal in Chicago instead of a terminal in Kansas City. This architecture minimizes the number of terminals and simplifies maintenance, while only slightly increasing long distance costs. Each of the terminals across the nation provides a similar function. FIGURE 2: Regional Terminals consolidate messages Figure 3 depicts how consolidated traffic at the regional terminals is sent over high capacity lines to the satellite uplink in order to minimize long distance costs. This network is being converted to a frame relay system, which allows higher speed and many alternative routes for a single connection. This is obviously desirable for back-up purposes when outages occur. An additional back-haul network has been implemented in the network for increased redundancy through a separate satellite link, which can route TNPP traffic from Dallas to Chicago. FIGURE 3: Long distance lines connect terminals to satellite uplink
The Direct Broadcast Satellite (DBS) architecture is the most valuable element of the network because it allows messages to be delivered anywhere in the nation. This point to multi-point distribution is shown in Figure 4. The satellite uplink transmits all messages to the satellite, which relays the signal to all transmitters across the country. These are currently located at more than 1700 sites in the USA. The Galaxy 4 satellite provides the backbone for this DBS architecture. FM (cubed) modulation is the protocol used to communicate with the majority of the transmitters although SCPC protocol is also used for the more distant sites such as Hawaii. Each transmitter “hears” all the traffic being sent from the uplink, but addressing in the satellite receivers will filter out only the traffic being sent to groups of transmitters on what is referred to as a “space segment.” The transmitter group that receives the message is determined by a code, which is derived from the coverage selected by the user. The transmitters combined into a “space segment” vary from a single city to a number of different markets around the country. This grouping is determined by geography as well as the volume of traffic on a channel and not by the number of transmitters in a group. FIGURE 4: DBS architecture provides point to multi-point Distribution
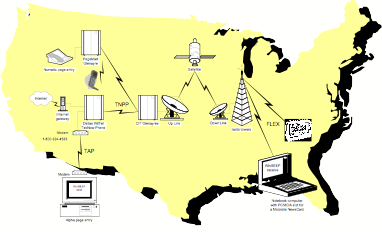
The available satellite bandwidth is divided into channels with bandwidths, which are typically 9600 bps or 19200 bps “pipes.” Using different technologies, these “pipes” can be as large as 76.8 kBd. Both the Motorola developed satellite protocol C-NET and the C2000 protocol from Glenayre are used in the network. A diagram depicting the overall connectivity of the network is shown in Figure 5. Since a major concern about this network approach is “what happens if the satellite falls from the sky?” PageMart has made provision at a number of key sites around the country to have the satellite antenna mounted in such a way that it can be easily redirected to an alternative satellite which is simultaneously being fed with redundant data. FIGURE 5: Overall diagram showing PageMart’s Direct Broadcast Satellite System. Initial design strategies The following discussion presents some of the key recommendations originally submitted by the designers of high-speed protocols such as FLEX. Transmitter power: In the early days of 512 bps POCSAG, paging transmitters were laid out with little regard to issues such as delay spread and as transmitters were developed to output more and more power, existing transmitters were replaced with higher powered equipment to compensate for the reduced sensitivity of pagers as they were redesigned to operate at 1200 bps and then 2400 bps. This reduction in sensitivity as measured in a laboratory environment and calculated based on the reduced energy per bit, was in the order of 2 to 3 dB for each increase in baud rate. Hence, when transmitters went from 150 watts to 250 watts and then to 500 watts, the service providers could essentially upgrade their equipment and save increasing the number of sites to maintain the same coverage footprint. Further reason for increasing transmitter power was to provide in-building coverage and “brute force” was the approach taken by most providers to penetrate heavily structured buildings and those constructed with reflective glass. These “quality” type problems resulted in transmitter sites being installed randomly within a city based only on customer demands with little regard to the overall system design. There are numerous examples of 3 or more sites all within a radius of a few miles in densely populated areas. Sites that are installed to deal with these quality issues are generally equipped with high power transmitters to penetrate buildings. The ultimate justification for increasing the power of base stations occurred in preparation for 6400 bps paging. The cellular type concept proposed, required high powered transmitters with unity gain antennas, to provide strong signals in smaller “cells” and hence, ensure capture of the paging receiver at all times from the nearest transmitter. This approach would necessitate more sites to maintain the existing coverage at 6400 bps. Coverage footprint: As discussed in the previous paragraph, the effect of increasing the baud rate would result in a corresponding reduction in the coverage footprint by up to 6 dB or more when systems are “up-speeded” from 512 bps to 6400 bps. In the ideal case of flat earth and 2 transmitters spaced perfectly apart with the minimum of overlap, we would also expect to see a “hole” materialize between the transmitters when the system is “up-speeded.” In order to compensate for these losses, it would be necessary to raise the transmitter powers accordingly. High sites: Up-speeding to 6400 bps poses a completely new challenge when mountainous terrain is involved. Since, delay spread is a major factor to contend with at 6400 bps, these systems need to be redesigned as the high mountain sites are removed. In order to maintain the identical coverage provided by these high sites, alternative sites need to be found which are low in elevation, have low antenna heights, and make use of low gain antennas. This will obviously mean that many more sites will be required. Delay spread: A delay-spread model that has gained support in the paging industry is proposed by Hess (Ref 1). For high-speed data systems he considers multiple interferers and views the received signal as a single transmission undergoing multipath delay spread. It is found that for delays limited to a fraction of the symbol time, the amount of signal degradation depends not on the actual delay profile, but on the rms value of the delays, weighted by their respective power levels. This offers an attractive way of handling multisource simulcast because it reduces the multiple delays and signal powers to a single parameter called multipath spread, which is equal to twice the rms of the delay profile. This expression is shown in Figure 6 where Tm refers to the multipath spread. FIGURE 6: Delay Spread expression The multipath spread for N simulcasting signals is given by:
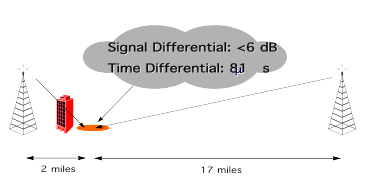
where Pi and di is the power and delay of the i-th signal, respectively. A rule of thumb requirement that has been accepted in the paging industry for some time is that the delay spread needs to be limited to an amount less than one quarter the symbol time for accurate decoding to take place. At 1200 bps this is 208 microseconds, at 2400 bps it is 104 microseconds and at 3200 b/s symbol time (6400 bps) this number is 78 microseconds. In terms of system design, this means we need to avoid any overlapping conditions where signal levels are within about 6 dB of each other and where one or more of the distant transmitters is greater than 15 miles away. Figure 7 illustrates in simplistic terms how shadowing of a signal from a nearby site can cause almost equal overlapping signals between 2 sites with a resultant delay that can be potentially damaging. FIGURE 7: RF shadowing causes delay spread
The diagram in Figure 8 shows areas of potential capture and where delay spread can occur. FIGURE 8: Potential areas of capture and delay spread
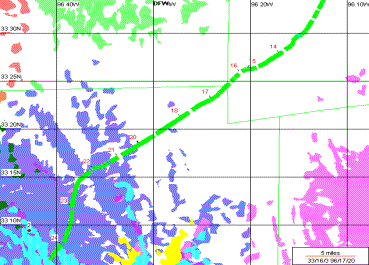
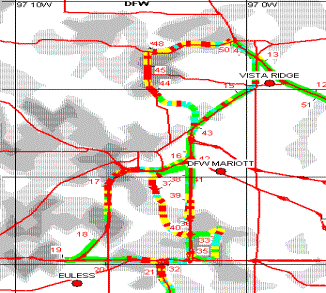
The challenge is to find these areas of delay spread and this can be achieved by either measurement or by computer modeling. Delay spread is the main reason why the designers of high-speed RF systems are proposing to move off high sites and use low sites with low gain antennas. Since many existing systems, can have transmitters on high sites spaced 20 miles or more apart, meeting the design criteria of no more than 15 miles of delta overlap will necessitate a redesign of the system. Large urban areas such as Los Angeles are difficult to redesign because of the need to have high sites to cover populations on either side of mountain ranges that run in different directions. Many more sites will be required to match the existing footprint. In a city such as Los Angeles, finding sites that meet our design criteria is difficult and lease rates for those sites that are available are extremely expensive. Frequency offsets: In previous POCSAG systems, frequency offsets have always been recommended due to the fact that overlapping signals of almost equal signal strength beat against each other creating nulls when 2 or more signals cancel each other. In a stationary position this can last for a significant time and hence corrupt the received data if the signal falls below receiver sensitivity. A frequency offset plan for POCSAG is recommended to have offsets in a range ± 500 Hz of the carrier frequency between simulcasting transmitters. Most pagers are designed for 4500 Hz deviation, and hence an offset of an additional 500 Hz would not exceed the band limit of 5 kHz and a deviation of 4000 Hz could easily be accommodated by the paging receiver. Before the advent of FLEX, transmitters were not required to have the frequency stability needed for 4-level modulation and hence most transmitters had an inherent offset by default. We may not have seen frequency variations as much as 500 Hz but there was probably enough difference between transmitters to essentially do the job without intervention. Paging reliability at lower baud rates was good enough so as not to be overly concerned about offsets and were hence, not implemented in the PageMart network. When high stability transmitters were introduced into the network, a slight drop in performance at 2400 bps was noticed but not significant enough to be a concern. The recommendation for FLEX transmission is that offsets are to be avoided at all costs. This is mainly due to concerns about the decoding of the inner symbols at ± 1600 Hz, which are required to have tolerances better than ± 10 Hz between transmitters. Implications and moves away from the initial proposals High power: This may not be a major concern in the UK and European markets since the level of transmitter ERP is tightly controlled and the issues we face in the States may not occur to the same extent in other countries. Since most paging companies did not design their site locations with any kind of “finesse” based on accurate RF models and ideal locations, sites were more or less selected based on what towers or buildings were available. Hence, in urban areas, most systems were over-designed to start with. Increasing the baud rate from 512 to 2400 bps and ultimately to 6400 bps (3200 b/s symbol rate), would probably not have affected the overall coverage footprint, even if the transmitter powers had not changed from the original 150 watt base stations. PageMart has never been a proponent of high transmitter powers and has limited the maximum power of transmitters to 300 watts (which are normally turned down to a little over 250 watts) and has preferred to make use of high gain antennas. The extra expense involved in increasing transmitter power to 500 watts, which is the maximum, offered for paging transmitters, does not seem to be warranted for the extra 2 dB of gain. A 500-watt transmitter will usually require a higher voltage source (in the US) than the 110 volts typically provided for at most sites and the power supplies add weight to the equipment. In addition, the antenna systems need special consideration since the types of connectors and filters used are generally rated below 500 watts. More important than this, however, is that the use of high power transmitters together with low gain antennas has indirect consequences, which has resulted in a huge cost to the industry. Signal levels within a half-mile radius of a high-power transmitter and unity gain antenna, attain levels between -20 to -30 dBm. Pager receivers have sensitivities better than -100 dBm. and signal levels of this magnitude create inter-modulation (IM) interference in the receiver that was never considered a few years ago. In general, IM rejection numbers for pagers at low signal levels are in the order of 55 dB. At high levels of signal, a pager receiver will probably achieve less than 10 dB of rejection. This means that a pager receiver can be rendered useless even if the desired signal is at -40 dBm (which is considered to be a strong signal), but happens to be near a high-powered transmitter creating “intermod.” This problem has resulted in pager manufacturers having to redesign their receivers. Introducing AGC can improve IM rejection to better than 40 dB in high signal environments. Even this cannot always resolve the problem when the signal level from the offending transmitter is very high. Also, this does not offer a solution to the thousands of pagers on the street that do not have this protection. To deal with this situation transmitters need to be added where they would normally not be required. The result is additional cost, maintenance, and more transmitters, which in turn may create IM problems for some other service provider. This issue becomes a spiraling “no-win” situation for all in the industry. The increased number of transmitters also impacts the system layout and design as it effects reliability at 6400 bps, which I will deal with later. “Intermod” problems have incurred a tremendous cost for everyone involved (pager manufacturers and carriers) and I believe this has been aggravated by the need to have higher-powered transmitters. Coverage footprint: As the transition occurred from 1200 bps to 2400 bps POCSAG, PageMart conducted propagation studies and field tests to determine the impact on our advertised footprint. The design criteria used for our coverage maps is reasonably conservative and tries to achieve better than 95% of the area covered in all types of environments from heavy structures to residences and in vehicles. Land use and land cover data (LULC) for the whole of the United States is utilized and loss factors up to 24 dB are assigned to different categories of land cover. In addition to these losses, allowance is made for up to 20 dB of Rayleigh type fading. Results of field trials from a single transmitter in a flat area with relatively no foliage, showed no major reduction of performance at 2400 bps within the boundaries of our 95% reliability contour. At the fringes of coverage, signal variations due to Rayleigh type fading are so significant (swings of ± 10 dB and more) that the reduced sensitivity of the pager by 2 to 3 dB at 2400 bps relative to 1200 bps is hardly a significant factor. The pager is just as likely to receive the page at either of these baud rates, but at a reliability level which is much below that which is acceptable for the industry. What happens beyond our published boundaries cannot be guaranteed and slightly reduced performance beyond these boundaries was not sufficient justification to increase transmitter powers or add more sites. As mentioned previously, coverage between transmitters could be a problem if the reduced sensitivity of the pager creates a “hole” in the middle of a published map. Our studies showed that only in rare instances did the reduced signal sensitivity at 2400 bps create the need for new sites, because most systems were probably over designed to begin with. With the advent of 6400 bps FLEX, similar studies were conducted around the country. A number of different factors have to be considered when 4-level modulation is introduced and initially, these were not fully understood. I will deal with the reduced sensitivity issue first. The comparison in this case is between 3200 bps 4-level (1600 bit/sec symbol rate) and 6400 bps 4-level (3200 b/s symbol rate). Figures 9 through 11 show the results of drive tests superimposed on the coverage footprint of the Dallas system. These tests were conducted in the fringe areas of coverage. Only a single dominant transmitter was used to transmit the test pages. Signal levels along this route are predominantly from this one site and are shown in Figure 9. FIGURE 9: RSSI plot in fringe area
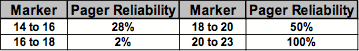
Signal levels or RSSI are shown in color where strong signals are indicated in red (> -50 dBm) and change in steps of 10 dB. Signal levels shown in dark blue are < -90 dBm and are considered marginal for reliable coverage. Since these levels were recorded with an external antenna on the roof of a vehicle, we see slightly better levels than what the pager would “see.” Coverage within the boundaries shown is where we would expect to see better than 95% reliability. The Bit Error Rate (BER) plots in Figures 10 and 11 show respectively the results of test pages transmitted at 3200 bps and 6400 bps over the same route. The color scale ranges from green (corresponding to good reliable alpha paging) through blue, yellow, and red (which corresponds to poor numeric paging) and is calibrated to actual pager performance shown between marker numbers in the tables. In both cases, we achieved better than 95% reliability within our predicted coverage footprint. The range at 3200 bps extends a few miles further than at 6400 bps. FIGURE 10: Single site BER plot at 3200 bps in fringe area
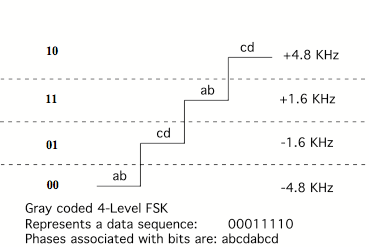
FIGURE 11: Single site BER plot at 6400 bps in fringe area It should be mentioned at this point that these tests are conducted for a worst case situation where a test page is a 40 to 80 character alpha message and the criteria for measurement is a perfect page or nothing. In other words, a single error in one of the characters being transmitted or a totally missed page is assumed to have the same weight in the reliability calculation. Another factor needs to be considered in carrying out these tests, and that is the sensitivity of a FLEX pager depends on the phase of the received page. The FLEX protocol requires interleaving of the data bits and the bits associated with the “b” and “d” phases always correspond to the inner bit of each symbol as shown in Figure 12. FIGURE 12: The four phases of FLEX at 6400 bps
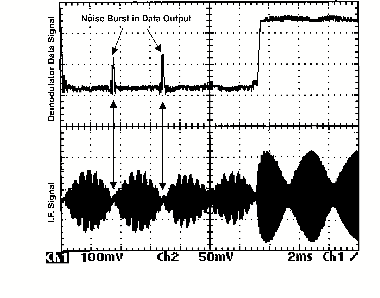
The decision processes in the decoding algorithm have a much better probability of correctly determining “a” and “c” phases since the threshold for this decision is whether the recovered symbol is above or below the zero crossing line only. The other 2 phases require a more critical determination around the inner level of modulation and has therefore more room for error. The net result is that “b” and “d” phase pagers have a reduced sensitivity by a factor of 2 to 3 dB relative to the other 2 phases. Hence, all our field testing is done for worst case with the test page always being sent in one of these 2 phases. Other protocols such as ERMES may not have phases as defined for FLEX but the resultant effect in decoding the inner-symbols will still be the same and hence reduced sensitivity will be apparent on all pages sent. The previous test considers the simplistic situation when only one transmitter is being considered. In this case it is apparent that from a sensitivity aspect alone, that we do not see a marked reduction in coverage. Even at 6400 bps the justification for increased transmitter power is not valid. A more realistic test, of course, is what happens in a simulcast environment? This will be discussed in the section under delay spread. High sites: From a service provider’s perspective, this is one of the more controversial and difficult issues to contend with. The implications of coming down from the high sites are obvious. The expense of replacing a single site could amount to 2 or 3 sites to many more depending on the situation. There is no question that at 6400 bps, high sites are a problem in that they affect delay spread. If one chooses to keep the existing high sites, managing the power from these sites becomes quite a challenge. One approach, which was attempted in the Los Angeles (LA) area, was to add a few more sites in the urban areas where our propagation studies showed weak signal levels. The idea would be to raise the general signal powers in the low lying areas to a point where only near-by sites would be “seen” by the receiver and would hence, capture the receiver over the distant high sites. Results from this exercise were not too encouraging. Pages were still being missed in strong signal areas and in some cases within a mile from the nearest transmitter. Plots of BER were studied and it became clear that high bit error rates were occurring in areas of overlap between low elevation sites within the LA basin. These areas correlated closely with where we noticed poorer pager performance. In an urban environment, the clutter causes a tremendous amount of RF scatter to occur. As a result, the receiver is subjected to a combination of Rayleigh fades and beating of signals from nearby transmitters. Fades of 25 to 30 dB can occur for short durations particularly in simulcast overlap areas. The cancellation of the strong signals from near transmitters will provide the opportunity for distant mountain sites to become a significant factor once more. The use of low gain antennas and high powered base stations will not help since signal beating and fading will still occur in the overlap zones. Total capture of the receiver will only take place in very close proximity of less than 1 mile from a transmitter site. Similarly, the use of low gain antennas on high sites will not help much in reducing the delay spread contribution from these sites. Consider the case where a 5000 ft elevation site has a clear shot at a receiver 20 miles away at sea level. The path loss can be considered to be close to free space. This will present an angle of a little less than 3 degrees below the horizon from the transmitter, which is well within the main beam of a typical gain antenna having a beam width of about 8 degrees. Changing the antenna at the high site to a unity gain will only reduce the contribution of this transmitter by approximately 8 dB. Experience has shown that this amount of signal reduction is not sufficient to reduce delay spread distortion. To really be successful at eliminating high sites from the equation, we need to reduce their signal contribution by more than 20 db in some cases. A reasonable compromise in dealing with the high site issue is to continue to make use of these sites, but to carefully control the energy radiated by making use of appropriate antennas. The use of high gain antennas with down tilt can reduce the signal on the horizon by up to 15 dB. In certain cases it may be necessary to use cardioid shaped patterns to get signals down to levels previously mentioned. This approach has the added benefit of concentrating most of the transmitted energy close to the mountain site where it is needed and is far more efficient than a unity gain antenna, which will radiate more than half of the transmitted energy above the horizon. In the same way that high mountain sites create delay spread at a distance, the inverse of having a receiver located at a height, such as in a high-rise building, results in the same problem. In relatively flat terrain and in a city such as Dallas, a paging receiver in a high-rise building above 100 ft will be subject to signals arriving from many distant sites. This high-rise phenomenon can be a major problem and the use of low gain antennas will not provide sufficient power reduction on the horizon as was previously described. The only real effective way of controlling the signal radiated by sites more than 15 miles away is with the use of specially designed high gain antennas with the appropriate amount of down tilt. Delay Spread: As alluded to in previous sections, the affect of delay spread is probably one of the most significant factors in the overall performance of systems at 6400 bps. We have conducted extensive tests at ground level and in high-rise buildings to determine what the appropriate values of delay spread should be for use in our models and the results are not all that encouraging. First, I want to briefly review how we can recognize the effects of delay spread by looking at the signal and then I will discuss three different scenarios where delay spread has a detrimental effect at high speed. When we look at the recovered audio signal from a paging receiver or service monitor, we expect to see a reasonable looking square wave. This may be somewhat smoothed at the transition edges due to the required filtering to limit the generation of frequencies beyond the specified bandwidth of transmission. In a simulcast environment where 2 or more signals are presented to the receiver with different times of arrival and when the signal level differences are less than 6 dB, we will notice spikes of overshoot occurring at the transition edges which could be positive or negative. These spikes are generated when phase cancellations occur in the discriminator as one signal which is undergoing a change in deviation level sweeps across another signal which has because of a time of arrival difference, not yet started its change in deviation. The multiple cancellations manifest as a single spike due to the filtering characteristics in the receiver. The size and width of the spike will depend on the depth of nulls generated and the amount of delay present. This is shown diagrammatically in Figure 13. FIGURE 13: Offset nulls and data modulation
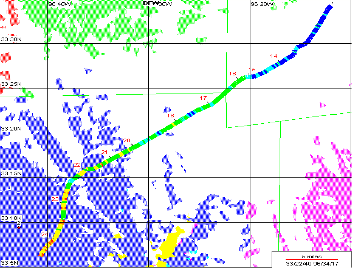
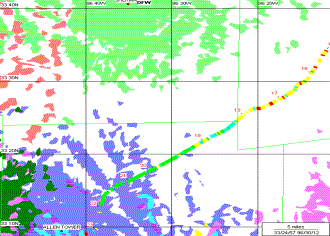
Spikes are also generated because of signal cancellations due to null beating and will be dealt with in the next section. However, these spikes can be discerned from simulcast spikes in that they can occur anywhere in the signal and are not confined the edge transitions (see Figure 20). Simulcast spikes are present whether we are transmitting 512 bps POCSAG or 6400 bps FLEX but “ringing” or “overshoot” is not a significant factor at lower speeds since we have ample time to sample the bit after the spike has occurred. This is not the case with 4-level modulation at 6400 bps. Distortion of the inner symbols makes the correct determination of the symbol a lot more difficult to achieve. This results in a significant reduction in performance when comparing 3200 bps 2-level with 6400 bps 4-level, which is at the same symbol rate The implication of this is that we can expect to see degraded performance, even in systems optimized for 3200 bps 2-level when 4-level modulation is introduced. Service providers need to be aware of this fact when implementing 4-level modulation schemes such as ERMES and FLEX. We have carried out many measurements to determine at what level of delay spread we start to see degraded performance at 6400 bps. It is important to conduct these tests with “b” or “d” phase pagers since optimization of systems need to accommodate for the worst case. Worst case is taking into consideration the decoding of the inner symbols in conditions as described above. Unfortunately, the minimum delay spread that we are able to tolerate before degradation in performance is about 40 microseconds. This is about half the number we had previously assumed and has serious implications in how we plan and design our systems for 6400 bps. The 3 scenarios of where and when to expect simulcast delay spread are presented below: (a) Overlap between sites within the coverage footprint: Even though sporadic occurrences of delay spread will affect reliability on a random basis, it is possible to predict areas where delay spread is going to be consistently bad in overlap areas. By using delay spread numbers ranging from 40 to 80 microseconds and by taking the beating of the 2 strongest signals into account, we have been very successful in identifying areas of reduced paging performance by using computer models. Figure 14 shows a BER plot at 6400 bps in the heart of the Dallas coverage area superimposed on a delay-spread plot, which is predicted by our software model. The BER results correlate very closely to results of actual pager performance, and verify our predictions. Delay spread is depicted with varying shades of gray where lighter shaded areas indicate 40 microsecond and darker areas 80 microseconds. FIGURE 14: BER plot at 6400 bps superimposed on delay-spread plot in center of the DFW market
(b) Low signal level simulcast. As previously discussed, reduced sensitivity at 6400 bps can account for a slightly reduced footprint when compared to 3200 bps and this was demonstrated with pager performance from a single transmitter. However, this is not the case in a 6400 bps simulcast environment where the fringe areas of coverage are subject to signals arriving from the many transmitters within a large metropolitan area. Pager performance at 6400 bps is dramatically worse than at 3200 bps beyond the coverage boundary and is mainly due to the effects of delay spread and simulcast “spikes.” This dramatic degradation of BER beyond the coverage zone is depicted in Figures 15 and 16 which compare performance at 3200 bps and 6400 bps over the same route as shown previously for a single site transmission. Neither improved pager sensitivity or increased transmitter power is likely to improve performance in this scenario. FIGURE 15: Simulcast BER plot at 3200 bps in fringe area
FIGURE 16: Simulcast BER plot at 6400 bps in fringe area
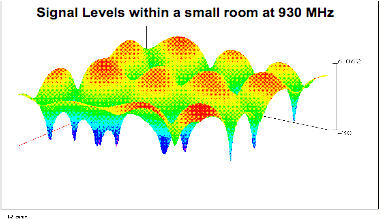
Again, tests with actual pagers are always carried out for worst case, and pagers are programmed for capcodes on the “b” or “d” phase. Test messages are approximately 80 characters of text. As is the case for reduced sensitivity of the ‘b’ and ‘d’ phase pagers, where noise makes it more difficult for good detection of the inner symbols, simulcast spikes create much more distortion of the inner symbols than the outer symbols. This again explains why we have consistently worse performance of pagers on ‘b’ and ‘d’ phase compared to those on ‘a’ and ‘c’ phases. (c) Strong signal simulcast in high-rise buildings and on the ground. These tests are carried out with pagers distributed around the room. What this tells us, is that capture as we know it in a laboratory environment seldom exists in the real world. Multiple signals reflecting off the walls and structures within the room and from outside the building result in an uneven pattern of nulls and peaks around the room with a Rayleigh like distribution. Some nulls may be more than 30 dB below average signal level. Signals from each transmitter result in their own independent pattern and each has its own slow time variant component, which can also be rapid depending on people movement within the room. A three dimensional depiction of this is shown in Figure 17. FIGURE 17: Multipath nulls in 3 dimensions
This complex signal environment explains why capture is not possible except in a few isolated locations within the room and also explains the pager performance previously described. The other component, which makes this environment even more complicated, is the presence of low frequency beats, which occur between simulcasting transmitters that are held to very tight tolerances. This time variant component will result in nulls of various depths occurring anywhere in the room. In a strong signal situation as I have described, total signal cancellation will not occur very often, but any amount of cancellation between 2 strong signals has the potential for delay spread to occur in the nulls. These simulcast-induced spikes are shown diagrammatically in Figure 18, which illustrate how the spikes occur in the nulls at the beat frequency between 2 signals. In this case delay spread spikes are as a result of 2 transmitters only and no other signals are involved. FIGURE 18 Simulcast spikes due to delay spread
Shown in Figure 19 are actual over-the-air-snapshots, which indicate total annihilation of some bits even at a 3200 bps symbol rate. In this picture, which captures a complete frame at 6400 bps, it is clear how “spikes” occur at the offset frequency of 16 Hz between the 2 transmitters involved. In this case, the delta signal level between the 2 transmitters is greater than 10 dB on average, but the receiver happens to be in a “multipath null” as previously described. It is also clear from these pictures that the bursts of “spikes” that occur in the nulls, last for longer than 20 milliseconds and is greater than the fade protection margin that the FLEX protocol can handle. This is partly due to the fact that independent beats occur for each deviation level and hence the nulls do not all occur at the same point in time. Keep in mind that not all the “spikes” are real damaging and error correction code will help tremendously in this situation. FIGURE 19: 6400 bps frames over the air indicating spikes in nulls at the offset frequency between 2 TX
As we add more and more transmitters into the mix, the null patterns become more complex and random and delay spread as a result of more distant sites can now become a factor within the nulls of the stronger signals from nearby sites. In this scenario, offset frequencies can be helpful if only 2 or 3 sites are involved. When many sites are involved, the benefit of offset frequencies is probably not significant. This is the very reason why a high density of transmitters in an urban area can be very damaging to high speed FLEX or ERMES. The high rise phenomenon is particularly susceptible to many sites being “seen” and sites with low gain antennas will be just as much a factor as those with high gain antennas. However, with appropriately designed high-gain antennas, we have the ability to control the level of signal on the horizon and can reduce the amount of interference from distant sites significantly. The scenario described above for high-rise buildings can also be found on the ground in the presence of very high signal levels where the receiver happens to be in the overlap between sites fairly close to each other (5 to 10 miles). This situation was previously described where we experienced high BER in the overlap between low elevation sites in the city of Los Angeles. The effect of beating and delay spread within the nulls is the same effect as in the high-rise. This coupled with Rayleigh fading in a moving vehicle explains the lack of capture and missed or corrupted pages even close to transmitters. Frequency offset and beat effects: As mentioned earlier, the recommendation for high speed FLEX systems was not to implement frequency offsets due to the tight tolerances required for recovery of the inner symbols. However, the downside of having simulcasting transmitters held to within 3 Hz of each other, which is typical for the transmitters we currently have installed, is that in an overlap situation where signal deltas are less than 6 dB, beating will occur between these signals at a very slow rate. Instantaneous peak-to-null differences can vary from 10 dB to greater than 60 dB if the receiver is in a stationary position. Because of the slow beat frequency, nulls can occur for longer than the 10 ms fade protection that is provided for in the FLEX interleaving code. It is also apparent from actual over the air measurements, that because of slight differences in deviation levels between transmitters, the beat associated with each deviation level is unique and affects each deviation level independently. This spreads the nulls over more data bits and causes more corruption than if the nulls occurred on all deviation levels at the same time. The result of these nulls on the recovered data is shown in Fig 20 which is an actual over-the-air snapshot illustrating that noise “spikes” can occur anywhere within the data signal. This can be extremely damaging in low signal simulcast overlap areas where nulling causes the resultant signal to drop below receiver threshold. Where there are strong signals present such as in high-rises, total signal cancellation does not happen often. Far more damaging, is when cancellation of the dominant signals due to beating, creates the opportunity for delay spread “spikes” to occur in the nulls. This of course also happens in low signal situations. FIGURE 20: Simulcast spikes associated with nulls from over-the-air snapshot
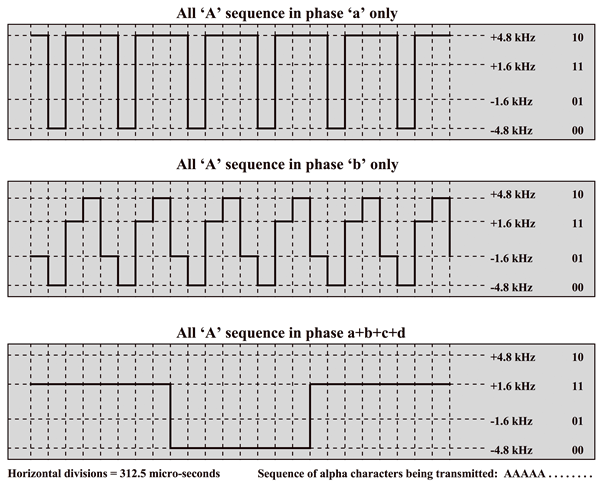
Reference to the previous Figure 19 also illustrates graphically the effect of “noise spikes” on the recovered data. The presence of spikes on the transition to the inner symbol of deviation and during the inner symbol is the worst case situation and explains why we see significantly worse performance of pagers programmed to receive ‘b’ and ‘d’ phases. The length of time a symbol remains at a particular level is dependent on the combinations of phases that are being transmitted simultaneously. For example, ‘b’ phase only will result in worse results than ‘a’, ‘b’, ‘c’ and ‘d’ together since the number of transitions to the inner symbols is greater and there are more symbols of 312 microsecond duration than in the latter case. An example of what the FLEX 6400 bps signal will look like for various phase combinations is shown in Figure 21. This example represents a string of “A” characters being transmitted. The net result is that a fully loaded channel will tend to have slightly better results than if only one of the ‘b’ or ‘d’ phases is being transmitted. FIGURE 21: 6400 bps FLEX signal for different phase combinations
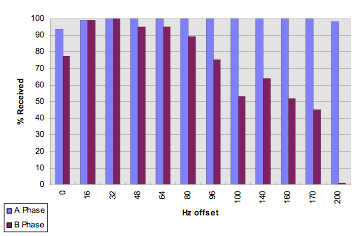
Laboratory measurements have shown that by implementing even small amounts of frequency offset between transmitters such as 8 Hz, we will significantly improve the performance of FLEX paging at 6400 bps. Figure 22 shows pager reliability as a function of frequency offsets between two Nucleus transmitters. FIGURE 22 Reliability measurements for different frequency offsets between 2 Nucleus TX
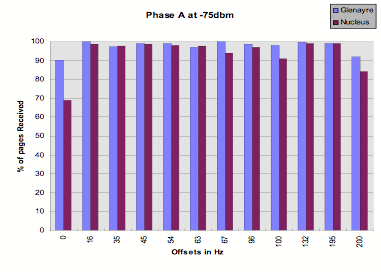
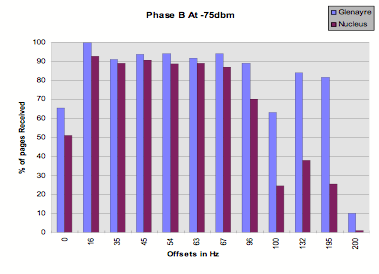
The charts shown in Figure 23 give comparative results between two transmitters from different manufacturers for ‘a’ and ‘b’ phases. We notice a roll off starting to occur at 64 Hz for the ‘b’ phase pagers and a significant “dip” in reliability at 100 Hz and 200 Hz which is expected due to the interleaving rate of 200 Hz or 5 ms and multiples of this frequency. The expected lower reliability at specific frequencies below 100 Hz did not occur. It is highly unlikely that these “traps” will ever be noticed in the real world because of the inherent “jitter” of the nulls that we see in a multi-path environment. FIGURE 23: Pager reliability at different frequency offsets for two different transmitter types
PageMart has been implementing offsets in systems as we transition to 6400 bps and we have been receiving favorable reports from the field. Special programs have been developed and incorporated in our modeling tools to calculate the appropriate offsets for each system. Minimum and maximum criteria are specified for acceptable limits between adjacent transmitters. The benefits of offset frequencies are mainly evident where only 2 or 3 transmitters are involved in the overlap and the error correcting code in the FLEX protocol has an opportunity to correct corrupted data in the null periods (or fades) that occur for less than 10 ms. When more transmitters are added to the mix in an overlap zone, less improvement can be expected from frequency offsets but our experience indicates that we still do better with than without. Other network related issues needing consideration in up-speeding systems System synchronization: From the material already presented, it is clear that the one issue, which has the largest impact on performance at 6400 bps, is the effect of delay spread. Fundamental to “power-delay” management is the assumption that all transmitters are perfectly synchronized to begin with. This is probably the biggest hurdle to overcome on the path to successful high-speed implementation. It is imperative that the service provider understands the issues involved in synchronizing their systems from the start. Many providers lean heavily on automated systems for synchronizing transmitters such as the use of monitor receivers and GPS receivers. Both these methods have problems and PageMart has moved away from relying on these techniques alone. Monitor receivers work reasonably well provided they are located in an “RF quiet” environment and are not subject to interference. This is obviously not the case in many urban areas. GPS systems are much better but we have also found instances around the country where interference or other local factors create problems in getting satisfactory GPS readings at a site. This has resulted in incorrect delay numbers being installed in the transmitter. Since the PageMart network architecture is solely satellite based, it is easy to compensate for time delay differences that occur on the paths from the satellite to each transmitter in a system. We have developed software tools to calculate these numbers exactly. Compensating for path delay differences is one thing, however, it is not always possible to have a completely homogeneous equipment mix in a network. Hence, measuring and knowing to within a few microseconds the differences in delay propagation through transmitters from different vendors, of different vintages, and different versions of software is essential. The method of synchronization through the use of monitor receivers will usually compensate for these differences but for reasons mentioned above, their readings are not always reliable. Use of GPS receivers also requires knowledge of the above-mentioned variables. Knowing the delay times through the Exciter and Power Amplifier (PA) of the transmitters is not sufficient and it will also be necessary to know the propagation times through the complete control and interface configuration. Component changes in newer versions of control equipment and upgrades to software have to be continually monitored and re-measured so that adjustments can be made to the delay numbers at the sites. During initial transitions from low speed to high-speed transmitters, it may be necessary to make adjustments to the rise-times of the modulating waveforms. The recommended number for FLEX 6400 is 88 microseconds whereas earlier POCSAG systems were 120 microseconds and greater. In certain transmitters, adjusting the rise-times would also affect bulk delay through the exciter. Since these adjustments were independent for POCSAG and FLEX transmission, if not done correctly, the monitor receivers would show systems to be perfectly synchronized whereas in reality, transmitters could be 100’s of microseconds out of synch. In systems where it is required to dynamically transmit FLEX and POCSAG over the same frequency, there may be different deviation limits set for each protocol. Some types of transmitters may not be able to dynamically alter deviation levels according to which protocol is being transmitted and it is essential that at least for the high-speed 4-level protocols these levels of deviation are held to exact tolerances between different types of transmitters. One of the major benefits of the FLEX protocol which has “saved our skin” in the transition to 6400 bps, is the ability to step up from 1600 bps to 3200 2-level and 4-level transmission modes. Early transitions to 3200 2-level were made because not all transmitters had been modified to provide 4-level modulation. Even though the symbol rate at 3200 bps 2-level is the same as at 6400 bps, we now know that simulcast spikes degrade performance when we introduce an inner symbol of modulation. Having the ability to debug system synchronization issues at 3200 bps where effects of delay spread are not that dramatic, is a tremendous help in the transition to 6400 bps. Obviously, as soon as a point is reached when all transmitters in a system have 4-level modulation capability, it makes no sense to run 3200 bps 2-level, and the system should immediately be switched to 3200 bps 4-level since delay spread effects at 3200 bps 4-level are almost non-existent. The inability of the ERMES protocol to provide this intermediary transition phase would be a major concern. Network related issues: This topic does not really fall within the scope of this discussion but does warrant some mention. Obviously when contemplating up speeding to 6400 bps, the network as a whole needs to be considered. In the PageMart configuration, one aspect of the network, which is critical, is the bandwidth and capacity of the satellite link to the transmitters. Various protocols are available in the United States and there can be large differences in the efficiencies of these protocols. In the beginning of our transition to 6400 bps, PageMart was using one type of protocol almost exclusively. Early expectations were that we would be able to transmit 2 channels of 6400 bps traffic on a single 19.2 kbps “pipe.” However, inefficiencies in the protocol caused dropped packets of data on adjacent channels if the bandwidth constraints were not being met. This resulted in extremely inefficient usage of the available bandwidth and was an unexpected expense when more “segments” had to be purchased in order to accommodate the traffic load. Another network related issue deserves some comment and is not necessarily a 6400 bps problem but more a symptom of the FLEX or synchronous protocols. In a satellite based configuration, there will be times when systems are adjacent to each other and are operating on different space segments. Paging receivers that operate on the same frequency will at times be able to receive signals from either segment. There is hence, a strong likelihood of a pager locking on to the wrong segment. These adjacent segments will need to be synchronized so that the FLEX frames are synchronous with each other. In order to achieve this, it is necessary to have a GPS receiver interface to each segment. Unfortunately, differences in satellite link protocols and even differences in baud rates between different channels may cause a time delay to occur between adjacent segments resulting in pagers “locking” on to the wrong system. RF modeling and measurement tools Without the necessary tools, contemplating 6400 bps speeds in urban areas where there is a significant build-out of transmitters can be a very risky proposition. RF models have traditionally only provided an approximation of expected signal levels. However, to adequately predict pager performance at high speeds, we need to include an additional feature of “delay spread” prediction and algorithms, which allow for system optimization. This can be implemented by making adjustments to transmit powers, antennas, and link delays. Delay spread predictions should take into account the effects of null beating and Rayleigh fading to get close approximations to reality. The PageMart model is custom designed and uses the TIREM (Terrain Integrated Rough Earth Model) algorithm for RF propagation prediction. The basic RF signal level and Delay Spread prediction model should at a minimum be able to accept the following inputs to make predictions as accurate as possible:
The model should have the following capabilities:
Many other features have been added to our model to allow for quick access to available data and the ability to be interactively responsive to changes in power, antennas, and site selections. Examples of drive test results superimposed on coverage and delay spread plots have been shown elsewhere in this paper. Obviously the most reliable piece of test equipment to measure pager performance is the pager itself. Given the variety of pagers on the market with just as large a variation in performance specifications, it is critical that a standard set of criteria be met. PageMart has a very stringent pager quality test program and only the best performing pagers are allowed access on the network. A standard test pager is selected for pager reliability testing and typically a minimum of 5 pagers will be used simultaneously to acquire sufficient statistical data. Test pages are transmitted at least once a minute. Gathering all this data, however, is not very useful unless it corresponds to location information so as to compare performance to predicted coverage. We do this test together with equipment, which records location co-ordinates from a GPS receiver. Manually entered marker numbers allow us to keep track of average reliability over short distances. The device we normally use for drive tests will have up to 4 receivers and decoders that can simultaneously record different frequencies, protocols and baud rates. RSSI samples are averaged and recorded at selected intervals but the sample rate is at least once every 800 microseconds. POCSAG and FLEX capcodes and associated data are recorded on a laptop computer. BER is calculated after every batch for POCSAG and after every frame for FLEX. The average BER is calculated between GPS recordings which is typically sampled every 5 seconds. The data files that are recorded are then processed and calibrated against actual pager performance before plotting and comparing to predicted coverage. Besides giving us the ability to view the data graphically and compare to actual pager performance, this test equipment is also invaluable in debugging system problems without which the transition to high speed paging systems would be, if not impossible, at least very difficult. Use of the traditional “service monitors” provides very limited information and has almost no value in diagnosing RF systems designed to transmit high-speed data. Recommended design strategies and transitionary phases on the path to high-speed paging on existing networks In this section I will essentially summarize the basic steps a service provider should take in the transition to high-speed paging using an existing infrastructure.
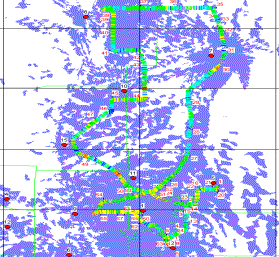
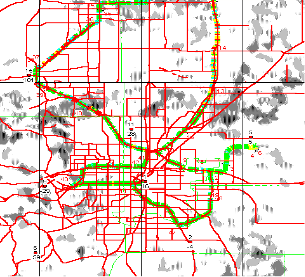
FIGURE 24: RSSI plot superimposed on coverage for Denver market
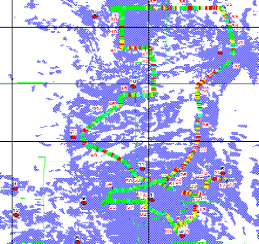
FIGURE 25: BER plot superimposed on coverage for Denver
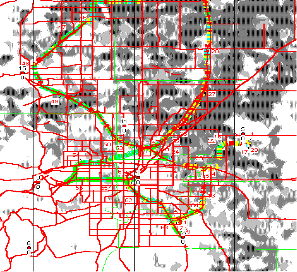
FIGURE 26: BER plot in Denver superimposed on Delay spread before optimization.
FIGURE 27: BER plot in Denver after optimization.
Product evaluation However well we design and maintain the network infrastructure, in the end, the overall quality of service we provide the end user, is dictated by the quality of the paging receiver products. For this reason, PageMart sets high standards for acceptance and all pagers are thoroughly tested before introducing them into service. Pagers are tested in a screen room and placed in a TEM (Transverse Electromagnetic Mode) cell, which is essentially a section of rectangular transmission line, which provides a uniform field at the desired frequency. The basic parameters evaluated are:
Sensitivity is usually tested against benchmark pagers that are known to have good performance. Pagers are evaluated in worst-case situations only. Therefore, tests are conducted at 6400 bps on ‘b’ or ‘d’ phase capcodes only. Sensitivity measurements are done in 8 different positions in the horizontal and vertical planes. The best position is used for the final measurement and is the RF level, which provides better than 90% reliability. If a pager does not meet a minimum range of acceptable performance, it is rejected at this point. Normally a sample set of at least 5 pagers will be tested. If the pager passes the sensitivity test and is a relatively unknown quantity, we will normally carry out further tests in the field. These tests are conducted in areas known for low signal simulcast as well as in locations where high signal level intermodulation exists. It is not uncommon to find paging receivers that have excellent sensitivity but extremely poor IM protection and simulcast performance. There is often a trade-off of sensitivity against these two qualities. Since most high-end alpha-numeric paging products will more than likely be used in large urban environments, we are often prepared to sacrifice a few dB of sensitivity for improved IM and simulcast performance. Not all pager manufacturers are aware of the issues at 6400 bps in a simulcast environment and it is critical that they focus more attention to delay spread and how it affects the decoding of the inner symbols. PageMart has worked very closely with major vendors in improving performance in this area and we have seen significant progress over the last year. Some of the latest products are able to tolerate delay spread much higher than 40 microseconds and the goal should be set at 100 microseconds. This is achievable with the use of DSP technology and we are seeing close to this performance level with pagers designed for two-way which have the same simulcast issues to contend with. The ultimate high-speed network using 2-way transmission In July 1994 PageMart was awarded narrowband spectrum licenses for frequencies in the 940 MHz and 901 MHz bands. These frequencies are designed for advanced messaging systems called Narrowband Personal Communications Services (NPCS). NPCS frequencies will permit two-way paging as well as voice messaging and will move paging into applications that are currently served by one-way technology. Currently there are over 42 million pager users in the U.S. and NPCS will provide the bandwidth to support continued customer growth and enhanced wireless message delivery to laptops and personal digital assistants (PDAs). Increased capacity will encourage two-way messaging and integration of paging with computers for message creation. In addition to providing a faster forward channel (940 MHz), the NPCS reverse channel (901 MHz) enables the system to pinpoint the location of a subscriber within a geographic area. The message can then be broadcast within a pre-defined region rather than across a whole network. This location technology allows for “roaming” and facilitates frequency reuse, which can increase network capacity by many times. Various types of acknowledgment services will be provided.
With two-way capability, the doors open to many more applications and extend to telemetry type services (either mobile or fixed). The future of this technology promises to be extremely exciting. PageMart plans to implement all these new services in the future. However, in the near term, the one major aspect of two-way, which is most attractive, is that the technology will provide the capacity to meet projected usage and be able to deliver high speed reliable alpha text messaging. In the U.S., alpha messaging is forecast to be the next most rapid growth market. This is the next logical step after the astronomical growth of numeric paging which has gained widespread acceptance in every market sector. Use of Internet and e-mail services allows easy origination of alpha messages from PCs and has resulted in an accelerated use of alpha text paging. In order to plan for this expected demand, PageMart is building out a nationwide network of transmitters and receivers, which will, for the most part, overlay on existing sites. This two-way network is the only way to support the capacity needs of the future and provide for reliable delivery of alpha messaging as we move into the next century. Figure 28 illustrates in a top-level diagram how one-way and two-way services will be integrated over a single network. The network will continue to make use of satellite links only as the backbone for both outbound and inbound transmissions. FIGURE 28: Network configuration for 1-way and 2-way Paging combined.
Conclusion A number of design strategies were initially proposed to prepare systems for high-speed paging. These all require significant investment from the service provider’s perspective in that large scale changes to the network are needed. These changes involve increasing transmitter powers, changing antennas to unity gain, removing high sites, and adding new sites to compensate for the high sites that are removed. Since these design changes result in reduced coverage from each site, creating an almost “cellular” like layout, we need to add more sites to provide the same coverage footprint. Recent proposals recommend designs, which make use of directional panel type antennas with lower height above average terrain. Again, this will probably require some re-arrangement and addition of sites. This approach will work well if a system is being designed from scratch. I have presented a number of reasons, which show that the former approach to the design of high-speed systems is expensive and flawed in that a high density of sites transmitting at high power causes many problems in a simulcast environment. These range from “intermod” issues to signal fades even in strong signal areas, which allow destructive delay spread “spikes” to occur almost anywhere in the coverage footprint. The expectation that the “capture” effect of FM will eliminate delay spread distortion from more distant sites did not work out and I have given reasons to explain this. The single most important factor to consider in the design of high-speed systems is delay spread. The results of drive tests were shown which demonstrate the effect of delay spread on pager performance at 6400 bps in fringe areas of coverage and well within the coverage footprint. Three different scenarios were presented where delay spread can affect paging. The PageMart approach to dealing with delay spread and the migration to 6400 bps is somewhat different from the strategies proposed above. No antenna changes, site moves or additions are considered until deemed absolutely necessary. Fundamental to this strategy is a heavy reliance on accurate computer simulation and having the tools to verify computer predictions. Systems are analyzed carefully for areas of delay spread before up speeding to 6400 bps. In the majority of cases, particularly in the more rural areas where simulcast is not a major concern, no changes other than frequency offsets are implemented. When the computer model does predict areas of delay spread in major centers, we attempt to “fine tune” the system for optimal performance in critical areas based on population densities. This optimization is carried out by making slight changes to link delays, which we call “simulcast offsets.” After this step has been implemented, the system is again thoroughly tested to verify the computer model. The final step in this optimization process is to change out antennas at high sites or those identified to be the cause of delay spread. Additional sites in “RF holes” and in the fringes of coverage may be required. This 4 step process of frequency offsets, simulcast offsets, some antenna changes and a few site additions, has proven to be very successful for PageMart and provides the quickest and most economically viable method of implementing a high speed paging network. Acknowledgments A special thanks to our team of engineers and technicians in the RF Department at PageMart who have helped compile the data presented and for their many hours in the field acquiring this data. Also, a special thanks to the engineers and managers at Motorola in the Advanced Messaging Systems Division in Fort Worth and the Paging Subscriber Division in Boynton Beach for allowing me to share their data and diagrams as well as their support and help in trying to improve system and product performance at 6400 bps. References 1. Hess, Garry C., Land-Mobile Radio System Engineering, 1993. |
|
FLEX, ReFLEX, FLEXsuite, and InFLEXion, are trademarks or registered trademarks of Motorola, Inc. If you would like to have a "pdf" file of this document, click here. |
![]()
| Home Page | Directory | Consulting | Newsletters | Free Subscription | Products | Reference | Glossary | Send e-mail |